TFD Ecogeomorphology
Background
From a geomorphic perspective, landscape evolution results from interplay between transport processes and landform morphology. As changes are made to any one process or landform trait, there follows a mutual adjustment of all other processes and the landform itself (Leopold et al. 1964). As a result, there is a quantifiable balance between process and morphology. From a wetlands perspective, processes in marshes and the characteristics used to describe marsh morphology must include both biotic and abiotic elements, but the underlying concept of a balance between process and morphology is likely valid. An important consequence of such a balance is that there is no unidirectional cause-effect relationship between abiotic and biotic conditions in this view. Rather, each influences the other at the same time through feedbacks. This study aimed to eludicate this dynamic interplay for the case of a tidal freshwater system.
Purpose
The overall objective of this study was to use a combination of field monitoring and statistical analyses to ascertain the process-morphology interrelations in a tidal freshwater marsh, with particular attention to the role of plant associations in these dynamics.
We propose that the environmental gradient in a tidal freshwater marsh may be numerically approximated using an approach similar to ‘‘weighted averages’’ but using a tidal freshwater marsh-specific indexing scheme. This theoretical development provides a quantitative means for relating plants to physico-chemical parameters and thus facilitates study of marsh geomorphology and ultimately marsh restoration. Once quantified using the environmental gradient function, plant associations were combined with substrate characteristics, sedimentation rates, and marsh geomorphology to assess the spatial predictability of habitat conditions and sediment dynamics in tidal freshwater marshes.
Methods
To meet the study objectives, plant associations in OPC had to be determined and their relationship to geomorphic conditions assessed. Because assessment of geomorphic variables required regular sampling, monitoring, and laboratory analyses, fewer sites could be used. Also, independent monitoring sites from an ecologically equivalent marsh were needed to test the applicability of the habitat index algorithm developed using OPC vegetation data. Given these constraints, the second need was met by monitoring marsh vegetation, biweekly sedimentation, surface-sediment characteristics, and marsh geomorphology in adjacent HBW, and then later on through a study monitoring those same conditions at independent sites in OPC.
Field methods
Field methods for characterizing vegetation are explained in the TFD Vegetation page and those for monitoring sedimentation rates are explained in the TFD Sediment Cycles page.
Surface sediment samples 0.3 m from each sediment station were collected in independent surveys to measure bulk density and determine grain size distributions. Samples for bulk density measurement were collected by coring the saturated sediments with a small, 26 ml acrylic tube. The samples were transferred to a pre-weighed ziplock bag and weighed. The sample weight divided by 26 yielded the bulk density in units of g·ml-1. Samples for grain size analysis were collected with a hand shovel, transferred to zip lock bags, and stored in a refrigerator at 4° C until analyzed.
Field surveys with Real-time Kinematic Global Positioning System (RTK GPS) units were used to locate all sites and map habitat boundaries. The State Plane Zone 1900 horizontal coordinates and NAVD88 vertical elevations of each tile were field surveyed by the Geodetic Measurements Section of the U.S. Army Aberdeen Proving Ground using a Trimble® real time kinematic GPS approach (vertical precision of ±1-3 cm). HBW habitats were delineated by walking boundaries with a hand-held differential MC-GPS® unit (horizontal precision of ±1 m). Habitat boundaries at OPC were delineated based on field observations and a Maryland Department of Natural Resources April 1994 color infrared digital orthophoto (1.2 m resolution).
Lab Methods
Grain size analysis required destruction of the organics in the sediment, separation of the fine and coarse fractions, and determination of the size distribution of each. The procedure of Folk (1974) was used for all of these tasks. In brief, organics were removed using H2O2 and coarse versus fine sediments were separated by wet sieving using a stainless steel, 63-micron sieve. After the first two tasks were accomplished, grain size determination of the coarse fraction was carried out by dry sieving. Grain size determination of the remaining fine fraction was carried out by the pipette 47 method (Folk 1974). The final outcome was the weight fraction of each inorganic sample by size.
GIS-Based Analysis
A GIS was made for OPC and HBW using Arcview® to organize spatial data and calculate geomorphic parameters. The base layer for the GIS was the April 1994 digital orthophoto. Distances between sites and the nearest first order channel was measured using the ruler tool. Distances between sites and the tidal inlet, nearest distributary channel, and subtidal front were calculated using Arcview’s “spatial join” between site points and vectors representing 44 channels and inlets. The Thiessen polygon method (Bedient and Huber 1992) was used to delineate areas within habitats represented by sampling stations.
Data Analyses
Stepwise multiple regression and associated statistical tests were used to generate predictive equations showing the more holistic interrelationships among the interdependent variables. Plant and marsh geometry variables were used to shed light on the mechanisms by which biweekly sedimentation, organic content, and grain size parameters were spatially distributed across the delta. Once again, conducting separate analyses for nonvegetated and vegetated periods isolated the effect of vegetation on delta sedimentation. All analyses were performed with Statistica (v. 98) by StatSoft (Tulsa, OK), and in each case, a forward stepwise scheme was used. Casewise deletion was employed within each analysis, but not between analyses to take advantage of the maximum number of sites available for understanding each dependent variable. Independent variables were checked for statistical significance with respect to their predictability of the dependent variable including potential redundancy where independent variables were themselves interrelated. When independent variables were standardized before regression, resulting parameters showed the relative contribution of each.
The F-value and resulting P-value were used as an overall F-test of the relationship between the dependent variable and independent variables (Lindeman et al., 1980). The Durbin–Watson statistic was used to check the assumption that the data consist of a random sample of independent observations (Brown, 1998). The probability distribution of residuals was checked to test the normality assumption inherent in multiple regression analysis. Any data points whose residuals were more than 2 standard deviations from their expected values were identified.
Ecogeomorphology Results
HBW Results
Sedimentation from July through November 1995 was plotted as a function of station habitat index to see if the habitat index alone revealed important sediment dynamics. A strong exponential decay was evident. Lower rates of sedimentation in the high marsh than in the low marsh have been observed elsewhere, but the degree to which the species-based habitat index can predict the gradient in sedimentation over a wide range of habitats shows the close relationship between sediment dynamics and species abundance.
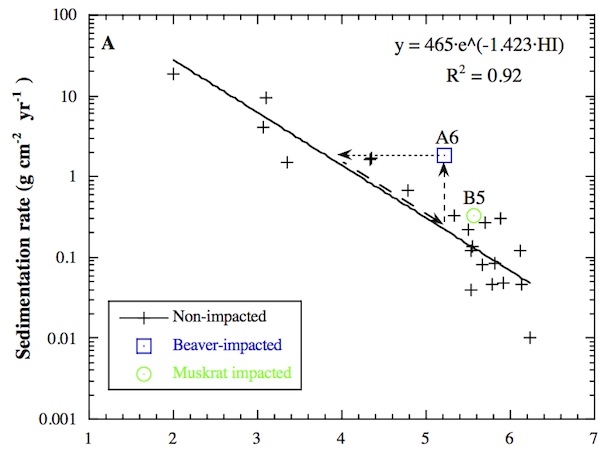
The habitat index was also useful for predicting the consequences of disturbance, such as animal activity, on the composition of plant species. Beavers (Castor canadensis Kuhl) and muskrats (Ondatra zibethicus L.) are the primary wildlife observed to affect marsh zonation at OPC, whereas nutria (Myocastor coypus Molina) dominate other systems. Unlike nutria, the animals at OPC do not cause widespread damage to the plants. Animal activities were observed to be important at the local scale, but it is not yet clear what role the localized changes play in overall wetland evolution. A comparison of data from sites with and without animal activity was published by Pasternack (2001).
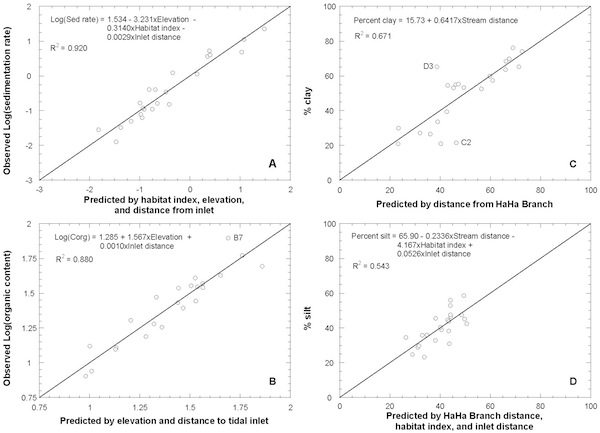
Stepwise multiple regression showed which variables controlled the spatial distribution of summer-average sedimentation rates. Elevation (m), distance to tidal inlet (m), habitat index, distance to the HaHa Branch stream (m), and distance to nearest tidal channel (m) were included as independent variables. Because elevation explains 83% of the variability in habitat index, statistical redundancy between these variables was checked. The logarithm of summer-average sedimentation rate was used as the dependent variable, as the data span 3–4 orders of magnitude. Of the independent variables, elevation, habitat index, and inlet distance were statistically significant above the 99% confidence level. Sedimentation rate was found to decrease with increasing elevation, habitat index, and inlet distance. These variables explained 92% of the spatial variability in summer sedimentation, with nearly equal roles for topography and plant association. Hydraulics and sediment transport, as indicated by distance from tidal inlet, played a lesser role. The three statistical tests described in the methods showed the multivariate relationship to be statistically significant and in accordance with the key assumptions of the analysis methodology.
OPC Ecogeomorphology Results
A correlation matrix (Pearson product-moment R2) was generated to explore the direct relationships among variables. Relationships that were statistically significant above the 99% confidence level (P < 0.01) were identified. Variables were broadly grouped as relating to plant associations (i.e. habitat index), biweekly sedimentation, substrate characteristics, or marsh geometry. Habitat index was most strongly correlated with elevation (see last plot on TFD Vegetation page).
Biweekly sedimentation variables were all strongly related to habitat index and elevation except for the sedimentation rate during the nonvegetated spring season. This group of variables was all interrelated above the 99% confidence level showing significant persistence between seasons. Summer sedimentation showed the strongest relations with habitat index and elevation, while annual sedimentation had weaker relations and spring sedimentation had no relations whatsoever. Channel transport pathways exhibited the weakest relations with habitat index that were still significant ( P < 0.05), but were not at all correlated with seasonal sedimentation. However, distance to the subtidal front did correlate with seasonal organic content. In these comparisons, distributary distance showed no significant relation to biweekly variables. Despite the fact that the accumulating sediments became the substrate, no relations were found between sedimentation variables and substrate variables.
For the time-average data during the nonvegetated, nonfrozen spring period, the logarithm of the sedimentation rate was poorly predicted by the independent variables. Four sites experienced erosion on average so they could not be accounted for given that the remaining sites showed a wide span of net depositional values. The only statistically significant independent variable that related to spring sedimentation was distance to the subtidal front. It accounted for just 33% of the spatial variability in sedimentation. In general, the further away a site was from the subtidal front, the less sediment it received. The F-test, Durbin–Watson statistic, and residual analysis all showed the relationship to be statistically significant and in accordance with the key assumptions of the analysis methodology.
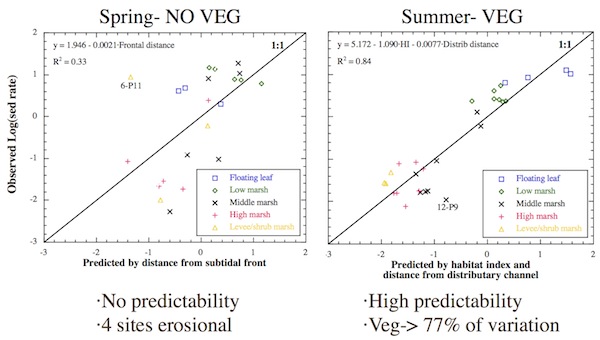
When sedimentation was low, the regression equation significantly overpredicted it. When sedimentation was high, the equation underpredicted it. Site 6-P11 was a significant outlier, and its higher than expected sedimentation rate was caused by suspended sediment deposition during spring flash floods in the small tributary adjacent to it.
For the time-average data during the vegetated period, habitat index and distance to nearest distributary channel were the only statistically significant variables and they explained the majority (84%) of the spatial variability in sedimentation. Sedimentation rate exponentially decreased as values for both independent variables increased, with habitat index accounting for 77% of the explained variance. The F-test, Durbin–Watson statistic, and residual analysis all showed the multivariate relationship to be statistically significant and in accordance with the key assumptions of the analysis methodology. Only site 12-P9 deviated by 2 or more standard deviations from its expected value.
Controls on OPC Organic Content
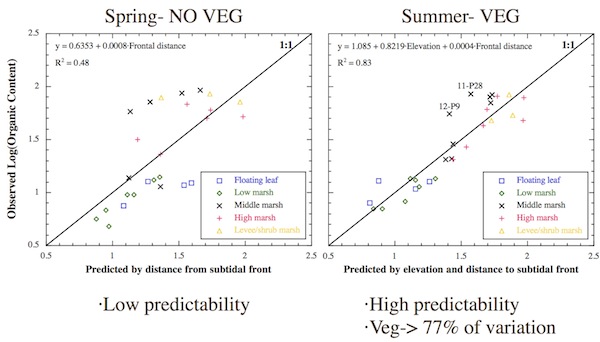
The multiple regression analyses of time-average organic content between nonvegetated and vegetated periods showed similar differences as those found for sedimentation. The logarithm of nonvegetated, nonfrozen organic content was predicted best by an equation containing only the distance to the subtidal front. This independent variable was positively correlated and explained half (48%) of the spatial variability in the dependent variable. Meanwhile, the logarithm of organic content during the vegetated period was predicted best by a combination of elevation and distance to the subtidal front. When these were combined in a multiple linear regression model, they explained 83% of the spatial variability in the dependent variable, with elevation accounting for the majority of that. Organic content increased exponentially with increasing values for both variables. Once again, statistical tests indicated that both analyses were statistically significant and in accordance with key assumptions. For the vegetated period, the residuals for sites 12-P9 and 11-P28 were both 2 standard deviations away from the expected value. The higher than expected organic contents at these middle marsh sites were observed to stem from high deposition rates of cattail seeds and related debris.
OPC Grain Size Patterns
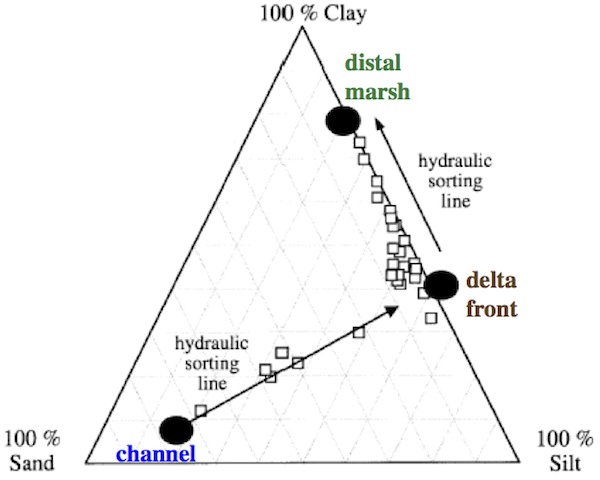 OPC Intertidal soils were predominantly composed of fines, except for a few sites near distributary channels. The average median grain size for collected samples was 8 um, and no particles larger than 1.41 mm were present. When percentage sand, silt, and clay was plotted on a ternary diagram, the data revealed three sediment endmember and two hydraulic sorting lines. The first endmember was primarily sand ( > 70%) with a median size of 85 um. It was best exemplified by site 9-P19, which was in the low marsh near the mouth of the delta’s southern distributary channel. The distributary channels themselves were highly sandy overall, and high wave energy preferentially attacked channel mouths, further winnowing fines. The second endmember was clayey silt with a median size of 3.52 um. Examples of sites with this substrate type were 2-P14, 3-P16, and 5-P8. These sites spanned several habitat types but were all relatively close to a distributary channel. The third endmember was composed of predominantly clay (>75%), with a median size significantly < 1 um. The OPC site most indicative of this endmember was 8-P18 on a small, high marsh platform remote from the subtidal delta front.
When grain size distributions were stratified by habitat, significant differences were apparent across the environmental gradient. Low marsh and levee/shrub marsh sites were composed of the coarsest material stemming from Winters Run bed load through the delta via the distributary channels. Frontal low marsh sites such as 1-P10 and 9-P22 accreted sand on a biweekly basis because of regular flooding, while levee/shrub marsh sites received sand only during overbank floods associated with large, infrequent storms. Floating leaf and high marsh sites had surprising similar grain size distributions. Middle marsh sites had the finest substrates because they were most distant from the subtidal front and distributary channels.
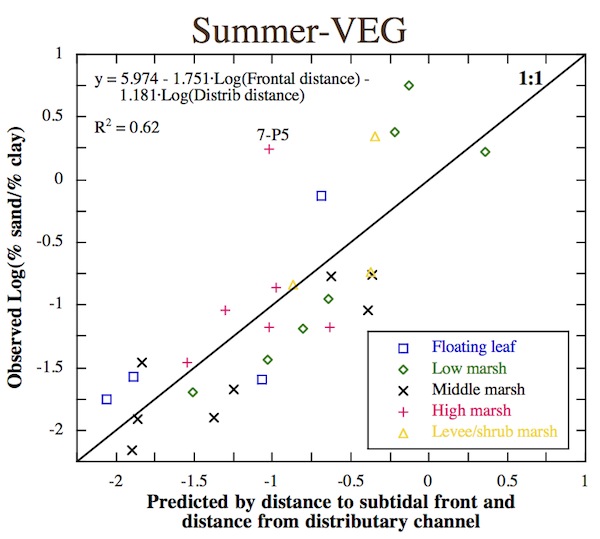
The logarithm of the ratio of percentage sand to percentage clay was chosen as a representative grain size parameter because it indicates extremes in energy conditions; a high ratio indicates a high energy regime that winnows away fines, while a low ratio indicates a quiescent site far from the parent total load of the system. In this case, stepwise multiple regression showed that the logarithm of the distance to nearest distributary channel and the logarithm of the distance to the subtidal front were the statistically significant controlling variables. The multiple linear regression model using these two variables accounted for 62% of the spatial variability in the dependent variable. This result lent support to the proposed hydraulic sorting lines, but once again showed that there must be many hydraulic and local geomorphic factors affecting size distributions of fines.
Discussion
Field mapping and process monitoring showed that strong spatial gradients exist for both vegetation and physical variables at HaHa Branch Wetland and Otter Point Creek. Both number of plant species and relative abundance of different species changed sharply across the deltas. Substrate grain size, elevation, and biweekly sedimentation rates also varied significantly over the same spatial scale. The existence of such patterns provides a basis for detailed assessment of their interrelationships.
The strongest support indicating the existence and extent of physical–ecological interactions at Otter Point Creek stems from multiple regression analyses. During the nonvegetated period following the thawing of ice in the marsh in early spring, the spatial variability in sediment dynamics is barely predictable using marsh geometry and not at all predictable using seasonal conditions in plant habitats or elevation. Thus, pattern of sediment deposition in the nonvegetated regime must be controlled entirely by physical process at subseasonal time scales. Pasternack (1998) investigated physical processes at hourly to biweekly time scales in more detail. He found that excess local deposition as seen at site 6-P11 and local scour as seen at site 9-P19 were driven by weather-induced events—flash floods for the former and wind-wave shear stress for the latter. Meanwhile, during the vegetated period of the year, time-average sediment dynamics were highly predictable using the spatial distributions of habitats in combination with marsh geometry. Intertidal vegetation apparently damps deviations in sediment transport caused by weather-induced events to yield a highly stable intertidal sedimentation regime.
The conceptual model that emerges is that during the growing season in late spring, elevation, marsh geometry, and hydrology determine where different plant species thrive. This explains why the habitat index, derived entirely from plant vegetation data, showed such a strong linear correlation with elevation. In turn, peak sedimentation occurs in summer coincident with maximum plant population densities. During that period, the spatial pattern in sedimentation is not directly dictated by elevation, as conventional wisdom might suggest, but rather is largely dictated by vegetation patterns, as indicated by the tight clustering of sedimentation rates with respect to the habitat index and not with respect to elevation. Elevation, distance from the subtidal front, and distance from the nearest distributary channel are important secondary factors in determining the spatial complexity of sedimentation patterns. Vegetation-directed sedimentation drives elevation change, which in turn feeds back on vegetation patterns. Thus, the analyses performed in this study reveal that at the habitat spatial scale (50– 104 m2) over a seasonal to interannual time scale, delta structure is the result of a tight, dynamic interdependence among abiotic and biotic processes.
Combining the results of this field study together with findings of other field campaigns (e.g. Leonard and Luther, 1995; Pasternack and Brush, 1998, in press; Pasternack et al., 2000) as well as mechanistic laboratory studies (Nepf et al., 1997; Nepf, 1999; Nepf and Koch, 1999; Nepf and Vivoni, 2000), it may be concluded that vegetation plays a definitive role in the transport and fate of sediment on a vegetated delta over short (hourly to interannual) time scales. However, are these time scales relevant to overall delta progradation, and if so, how do short-term cycles of deposition and erosion scale up? While the latter question will take more research to answer, we hypothesize that the primary geomorphic relevance of short-term, vegetationinduced sediment trapping is that it retards of the rate downstream sediment dispersion, thereby yielding a shorter delta with a steeper gradient. When no vegetation is present on a delta, wind waves and tides can disperse sediment over significant distances yielding a very different morphology and environmental impact. For the Chesapeake Bay estuary, the widespread reclamation of deltaic and fringing tidal freshwater vegetation is likely causing the now nonvegetated sedimentary deposits and new sediment yielded from the watershed to disperse much further down tributaries where it clogs harbors and perhaps out to the main bay. Also, the nutrients and toxics adsorbed to the sediment are likely harming a much greater region of the aquatic ecosystem. Thus, subdecadal physical processes on a vegetated delta are highly interdependent with ecological conditions and should scale up to effect longer term delta progradation.
Publications
- Pasternack, G. B. 1998. Physical dynamics of tidal freshwater delta evolution. Ph. D. Dissertation. The Johns Hopkins University, 227pp, 5 appendices.
- Pasternack, G. B., Hilgartner, W. B., and Brush, G.S. 2000. Biogeomorphology of an upper Chesapeake Bay river-mouth tidal freshwater marsh. Wetlands 20:3:520-537.
- Pasternack, G. B. 2001. Animal Response to River Evolution in the Tidal Freshwater Zone. In (J. M. Dorava, D. R. Montgomery, B. B. Palcsak, and F. A. Fitzpatrick, Eds) Geomorphic Processes and Riverine Habitat. American Geophysical Union, Water Science and Application Volume 4, p. 139-157.
- Pasternack, G. B. and Brush, G. S. 2002. Biogeomorphic controls on sedimentation and substrate on a vegetated tidal freshwater delta in upper Chesapeake Bay. Geomorphology 43:293-311.
