TFD Sediment Cycles
Purpose
One aspect of tidal freshwater wetlands that remains poorly understood is the temporal dynamics of marsh surface accretion in response to various external forces and internal processes. Orson et al. (1992) postulated a surface accretion model to explain seasonal conditions in Delaware marshes. According to the model, significant summer deposition is stabilized by vegetation that dies off in the early autumn and blankets the marsh surface. While some of this material becomes incorporated into the marsh matrix, an unknown amount is thought to be resuspended and exported during the winter months when no vegetation is present. The research conducted in this study involved intensive field monitoring in two adjoining but different different deltas that showed the seasonal sedimentation cycles existing in a tidal freshwater marsh, with particular attention to differences between habitats. This research also tests the surface accretion model of Orson et al. (1992).
Methods
Field Methods
Sediment sampling stations using the Net Sedimentation Tile protocol were established at all HBW and OPC sites in July 1995 and August 1996, respectively. Stations were visited once every two weeks at low tide. Accumulated sediments were scraped into pre-washed and pre-weighed glass jars. Erosion was recorded by measuring the height of each tile edge and the anchor rod above the marsh surface, averaging the measurements, and multiplying by bulk density. Local scour was negligible. Where erosion and deposition were evident, the two methods were combined to obtain net sediment accumulation.
Lab Methods
All bi-weekly sediment samples were processed in the laboratory to obtain wet weight, dry weight, water content, organic content, and sedimentation rate. Exteriors of jars were washed and dried to remove excess material. Jars with samples were weighed, opened, heated in an oven at 80° C until completely dry, and weighed again. Even though samples were collected bi-weekly, dry weights per tile were annualized to units of g·cm-2·yr-1 to facilitate comparison with previously reported values. Where measurable accumulation occurred, a fraction of each dried sample was homogenized in a crucible and combusted at 450° C until the mass was nearly constant, which was found to be 8 hours. For the many instances where dried weights were low or much plant litter was present, the whole sample was homogenized and then combusted at 450° C. After combustion, the samples were re-weighed to yield loss-on-ignition (LOI). No adjustment of LOI was made to account for sulfur oxidation to SO2, because this element is not a significant constituent in the freshwater environment (Odum 1988). Thus, LOI is a good measure of organic content.
Data Analyses
Sedimentation rates and organic contents measured at HBW and OPC show significant spatial and temporal variability. To see if habitat differences explain some of this variability, vegetation data were analyzed and used to organize sediment data into habitat-stratified sets and habitat-averaged time series. Habitat-stratified data sets were examined to compare within-habitat and between-habitat variability. Habitat-averaged time series were analyzed to determine if they exhibit nonrandom trends. They were also assessed to determine which habitats had distinct average sedimentation rates.
Box and whisker plots were used to compare within-habitat and between-habitat variability. For each habitat, a horizontal line through the box indicates the median sedimentation rate. The box top delineates the upper quartile (point halfway between median and maximum), while the box bottom delineates the lower quartile (point halfway between median and minimum). Whiskers are located at 1.5 times the interquartile distance (distance between upper and lower quartiles) beyond the limits of the upper or lower quartiles. Circles are outliers beyond the whiskers.
Results
HBW Sedimentation Cycles
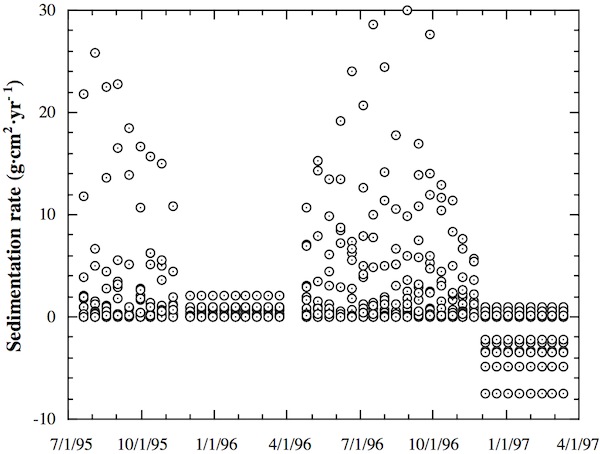 Raw deposition rates measured at HBW ranged from -7.43 to 29.96 g·cm-2·yr-1 over the 88 week study period. Eighty percent of measured values fell between 0 and 2 g·cm-2·yr-1, with the mean 1.21 g·cm-2·yr-1 and median 0.16 g·cm-2·yr-1. These rates correspond to 19 g and 2.5 g of material deposited per tile per two weeks, respectively, indicating a net growth for the marsh over the study period. Organic deposition ranged from -1.38 to 2.56 g·cm-2·yr-1, with the mean 0.16 g·cm-2·yr-1 and median 0.06 g·cm-2·yr-1. These data indicate a strong positive skewness in the distribution of deposition rates.
Two distinct regimes are evident in HBW sedimentation. From late November to mid-March sedimentation rates were low or negative with little variability between sites. From mid-March to late November sedimentation rates varied by as much as 2.5 orders of magnitude between locations.
When stations were stratified by habitat type, differences in within-habitat and between-habitat variability were found to depend on the stage of the vegetation growth cycle for the marsh. From mid-March to late November all habitats had vegetation growing on the marsh surface. During that interval for both years, sedimentation rates showed a secular decrease from habitat to habitat. The pioneer mudflat received the most material, with a mean of 18.06 g·cm-2·yr-1, while the high marsh received the least, with a mean of 0.23 g·cm-2·yr-1. Outliers and whiskers show that the total range of sedimentation rates within a habitat overlapped with differences between habitats. However, when just the interquartile range (boxes) is considered, the only significant overlap was between the floating leaf and low marsh habitats in 1996.
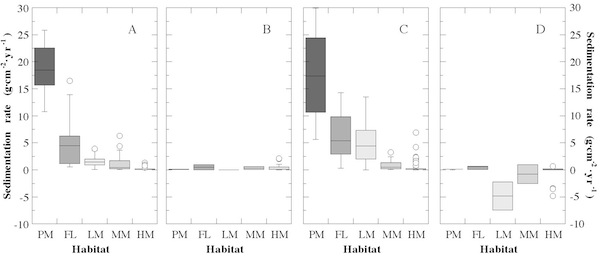
From late November to mid-March no plants grew on the marsh surface, though a few species’ dead stalks remained standing in the middle and high marsh habitats. During that interval, no secular trend in sedimentation was evident. The floating leaf habitat received the most material, with a mean of 0.46 g·cm-2·yr-1, while the low marsh showed the most erosion, with a mean of -2.41 g·cm-2·yr-1. Winter 1996 was colder than average, with a major blizzard hitting Maryland in January. As a result, HBW was frozen from December to March and material deposited in late November was trapped until spring. In contrast, winter 1997 was very mild, and HBW was only frozen for brief intervals in November, January, and February. As a result, significant erosion occurred, particularly in the low marsh and along the boundary between the low marsh and high marsh. Other than the erosion in the low marsh in 1997, within-habitat variability was comparable to between-habitat variability during the winter dormant period in the vegetation growth cycle.
When sedimentation rates for stations of the same habitat were averaged for each two week sampling period, cycles of deposition and erosion were found for each habitat. Summary statistics for the habitat-averaged time series show that each habitat had a distinct average condition with significant temporal variability. The number of habitat-averaged values varied between habitats because floating leaf and low marsh tiles were destroyed in winter 1996. To test the hypothesis that the observed cycles were nonrandom, habitat-averaged time series were put through the U test of randomness for runs above and below the median (Freund and Simon 1991). All series were found to be nonrandom above the 97 % confidence level, with most well above the 99 % level.
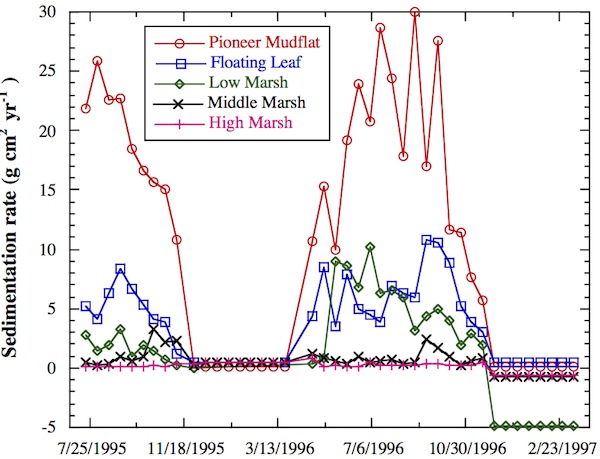
Beginning in spring, deposition increases steadily as plants grow. Throughout summer grown plants are densely packed so their trapping potential keeps sedimentation rates high, with significant variability between habitats caused by differences in trapping between plant associations. In autumn, total deposition drops off rapidly as marsh plants die, but an influx of organic riparian debris raises the sedimentation rates for middle and high marsh sites. Depending on the timing of the onset of winter and the duration of below freezing conditions, ice locks deposited materials in place or lack of ice allows for significant erosion from late November to mid March.
By averaging organic deposition rates for stations within the same habitat type, annual cycles similar to those found for total sediment were revealed for the quantity of organic deposition. The pioneer mudflat received the most organic material (0.88 g·cm-2·yr-1) and the high marsh the least (0.03 g·cm-2·yr-1). There were fewer organic deposition (and organic content) habitat-averaged values because negative and zero accumulations may not yield any sediment for determining these quantities. Once again, the u test of randomness for runs above and below the median provided strong confidence (99 %) that the time series were nonrandom.
Organic deposition as a percentage of the total (i.e. organic content) also shows nonrandom cycles, but they are inverted relative to those for total deposition and organic deposition.
Organic content was highest in the high marsh (41.11 %) and lowest in the pioneer mudflat (7.93 %). In winter, organic content is steady due to ice conditions. When the ice melts in March, organic material is decomposed and exported out of the system. Organic content drops through spring as exports continue and plants grow. The minimum is reached in mid summer when plants are at a peak density and inorganic deposition is highest. As plants blow down and decay in late summer and autumn, the organic content of deposited materials increases. Additional pulses of organic detritus are contributed by adjacent riparian buffer zones, particularly to the high marsh. In late autumn some of this debris migrates to the middle and low marsh areas before ice locks it in place for the winter.
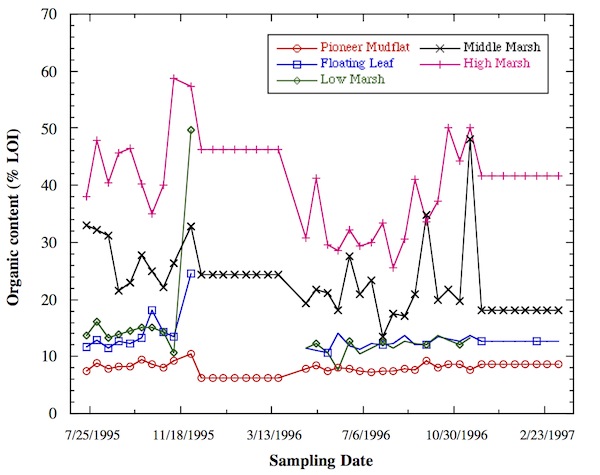
The rank-sum U test for large samples assesses the null hypothesis that two samples come from identical populations (Freund and Simon 1991). This test was applied to the habitat-averaged summer values of each data set. For total sedimentation and organic deposition, all means were found to be different at a confidence level greater than 99.98 %, except for floating leaf versus low marsh, which were different with a confidence level of 92 % for the total and 86 % for organic. The differences between floating leaf and low marsh habitats are significant, and further confidence is justified by the susceptibility of low marsh sites to winter erosion in contrast to the floating leaf sites, which did not experience erosion. For organic percentage, the means of floating leaf and low marsh were different with a confidence of only 65 %, indicating that the type of accumulations are similar, even though their fates are different. Otherwise, all means were different with a high degree of confidence (>99.8 %).
OPC Sedimentation Cycles
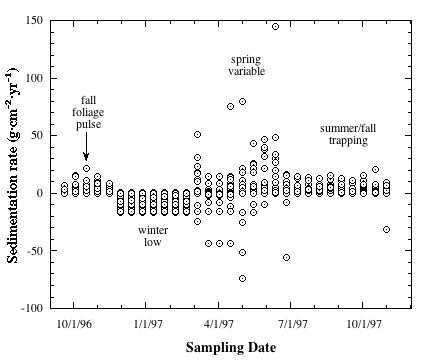 The deposition rates measured at OPC ranged from -74.15 to 145.24 g·cm-2·yr-1 over the 52 week study period. Fifty-nine percent of measured values fell between 0 and 2 g·cm-2·yr-1, with the mean 1.0 g·cm-2·yr-1 and the median 0.07 g·cm-2·yr-1. These rates correspond to 15.3 g and 1.0 g of material deposited per tile per two weeks, respectively, indicating a net growth for the marsh over the study period. Organic deposition ranged from -7.69 to 26.39 g·cm-2·yr-1. The mean rate of organic deposition (0.15 g·cm-2·yr-1) is more than double the median (0.06 g·cm-2·yr-1), showing that the data is positively skewed. Three distinct regimes are evident in OPC sedimentation. From mid- November to March sedimentation rates were low or negative, with little variability between sites. From March to mid-June sedimentation rates showed extreme spatial and temporal variability. From mid-June to mid-November there was spatial variability but little temporal variability.
As was done for HBW, OPC stations were stratified by habitat type to assess differences in within-habitat and between-habitat variability. For the mid-June to mid-November interval, sedimentation rates showed a secular decrease from habitat to habitat. The floating leaf habitat received the most material, with a mean of 9.29 g·cm-2·yr-1, while the levee/shrub marsh received the least, with a mean of 0.16 g·cm-2·yr-1. In 1996 there was little significant overlap between habitats, while in 1997 middle marsh, high marsh, and levee/shrub marsh sites showed complete overlap.
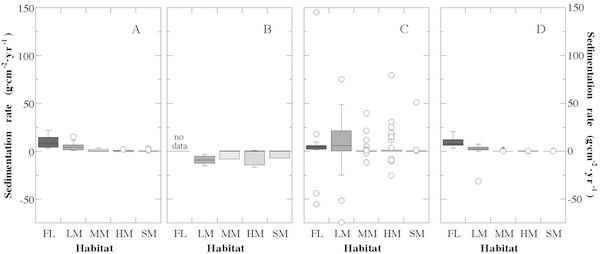
For the mid-November to March interval, all habitats eroded, with no trend in between-habitat erosion. The low marsh eroded the most, with a mean of -9.02 g·cm-2·yr-1, while the levee/shrub marsh eroded the least, with a mean of -1.74 g·cm-2·yr-1. Beside the low marsh, frontal high marsh sites experienced substantial loss, with a mean of -5.59 g·cm-2·yr-1. From March to mid-June sedimentation rates showed extreme variability, as indicated by the large number of outliers. During that period within-habitat variability exceeded between-habitat variability.
In terms of organic content, all time intervals show floating leaf and low marsh habitats having similar low percents and middle, high, and levee/shrub marsh habitats showing similar high percents. From mid-June to mid-November the levee/shrub marsh had the highest organic content, with a mean of 61.14 % LOI, while the floating leaf habitat had the lowest, with 11.66 %. From mid-November to March the middle marsh had the highest organic content. Examination of the organic material showed that the source of organics in the middle marsh was dead stalks of Typha angustifolia from adjacent plants. Typha angustifolia is one of the species whose dead stalks remain upright through most of the winter. Given the large areal extent of the Typha angustifolia plant association at OPC, there is a large amount of organic material to be deposited in the middle marsh where this association is found. As a result, the amount of organic deposition in the middle marsh exceeds that in the less widespread high marsh.
When sedimentation rates for stations of the same habitat were averaged for each two week sampling period, cycles of deposition and erosion were found for four out of five habitats. Summary statistics for the habitataveraged time series show that each habitat had a distinct average condition with significant temporal variability. The floating leaf habitat received the most material (5.23 g·cm-2·yr-1), while the high marsh received the least (-0.39 g·cm-2·yr-1).
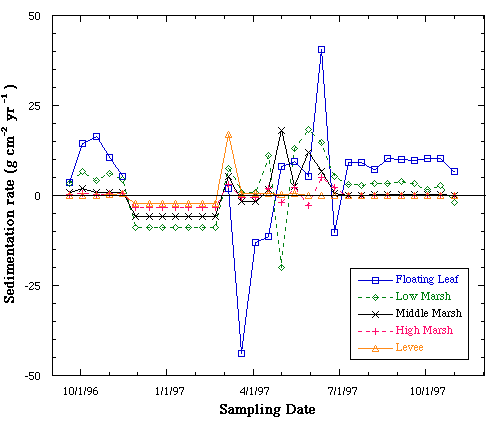
During early spring, the floating leaf habitat experienced six weeks (March 6 - April 17, 1997) of extreme erosion that peaked at -43.77 g·cm-2·yr-1 in mid March. Thereafter erosion gave way to deposition, which peaked at 40.55 g·cm-2·yr-1 in mid June. Because of the magnitude of spring and early summer bi-weekly variability, the u test of randomness for runs above and below the median found that the annual cycle in the floating leaf habitat could not be distinguished from random noise.
In contrast to the floating leaf habitat, the remaining habitats did show nonrandom annual sedimentation cycles. The OPC low marsh did not experience much erosion in early spring, except during the last two weeks of April when there was -15.99 g·cm-2·yr-1. Relative to the low marsh, the middle and high marshes experienced much less variability in sedimentation, while that in the levee/shrub marsh was nearly constant.
The cycles in the quantity of organic deposition mimiced the total sedimentation cycles, while organic content cycles showed different fluctuations. The floating leaf habitat received the most organic material (1.77 g·cm-2·yr-1) and the high marsh the least (-0.07 g·cm-2·yr-1). The low marsh had the lowest organic content (11.16 %), whereas the levee/shrub marsh had the highest (58.74 %). Peak organic contents for all habitats occurred in late autumn (concurrent with the decay of in situ marsh plants and influx of leaves and woody debris from adjacent forests). The middle, high, and levee/shrub marsh habitats also show springtime peaks. The U test of randomness for runs above and below the median shows that the middle, high and levee/shrub marshes have nonrandom cycles in organic content. The floating leaf and low marsh habitats do not have enough variability to generate a statistically significant trend in organic content.
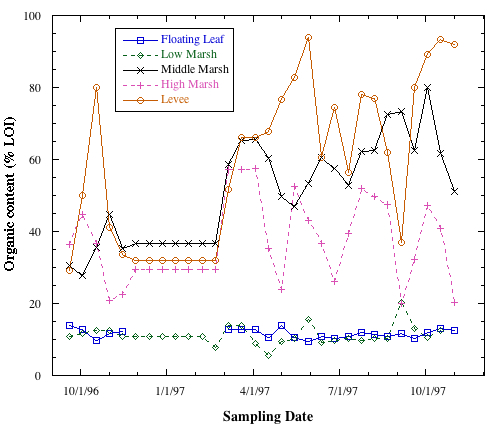
To test whether deposition was different between marsh habitats, non-parametric tests were applied to the July through October 1997 habitat-averaged data. July through October data were used because deposition was nearly constant during that interval For total sedimentation and organic deposition, all means were different above the 97 % confidence level, except for high marsh versus levee/shrub marsh, which were different with a confidence level of 90 % and 66 %, respectively. The high marsh received more sediment than the levee/shrub marsh, but because they have similar species compositions, the quantity of organic deposition was similar. For organic content, the means of floating leaf versus low marsh as well as middle marsh versus levee/shrub marsh were virtually identical. These similarities show that the deposits have similar compositions, but different fates. All other organic content means were different with a high degree of confidence (>99 %).
Within-Habitat Variability
Data from multiple NST sites within each habitat type were used to investigate the within-habitat variability in sedimentation and organic-content cycles. For details on those results, please see the publicaitons below.
Publications
- Pasternack, G. B. and Brush, G. S. 1998. Sedimentation cycles in a river-mouth tidal freshwater marsh. Estuaries 21:3:407-415.
- Pasternack, G. B. 1998. Physical dynamics of tidal freshwater delta evolution. Ph. D. Dissertation. The Johns Hopkins University, 227pp, 5 appendices.
- Pasternack, G. B. and Brush, G. S. 2001. Seasonal Variations in Sedimentation and Organic Content in Five Plant Associations on a Chesapeake Bay Tidal Freshwater Delta. Estuarine, Coastal, and Shelf Science 53:93-106.
