TFD Vegetation
Purpose
The overal goal of this research was to ascertain the role of an environmental gradient along the tidal freshwater delta in grouping plants into distinct associations with characteristic indicator species. Specific objectives were to (1) determine which TFD herbacious plant species tend to co-locate as a plant association, (2) quantify the number of TFD plant associations, (3) identify indicator species for each association, (4) analyze plant associations for presence along an environmental gradient, (5) develop an algorithm for converting plant species abundances at a site into a single "habitat index" that quantifies the position of the site along the enivornmental gradient, and (6) test the veracity of the habitat index by performing regreesion analysis between it and site elevation.
TFD Plant Association Methods
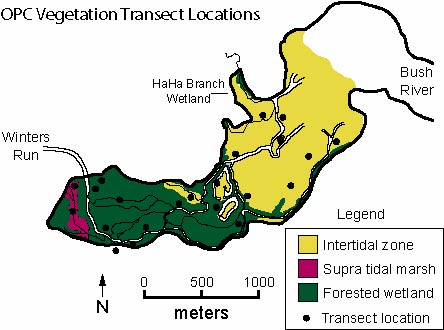
Herbaceous vegetation in the intertidal and supratidal marshes at Otter Point Creek (OPC) was surveyed in 1991-1992 in 115 1-m2 quadrats at 5-m intervals along randomly located, 50-m-long belt transects (Figure 1 below). Percent cover of herbaceous plants and saplings was determined by counting leaf cover for each species within each square decimeter of a 1-m2 quadrat (Mueller-Dombois and Ellenberg 1974). With different layers in the vegetation, total cover could exceed 100 %. Relative percent cover was calculated by dividing the percent cover for each species by the total percent cover of all plants in a quadrat. No trees were observed in or near any of the quadrats. All vegetation data are reported in Hilgartner (1995), available upon request. Taxonomy follows Fernald (1970), except Microstegium vimineum from Hitchcock and Chase (1950) and Phragmites australis from Tiner and Burke (1995).
TFD Plant Association Results
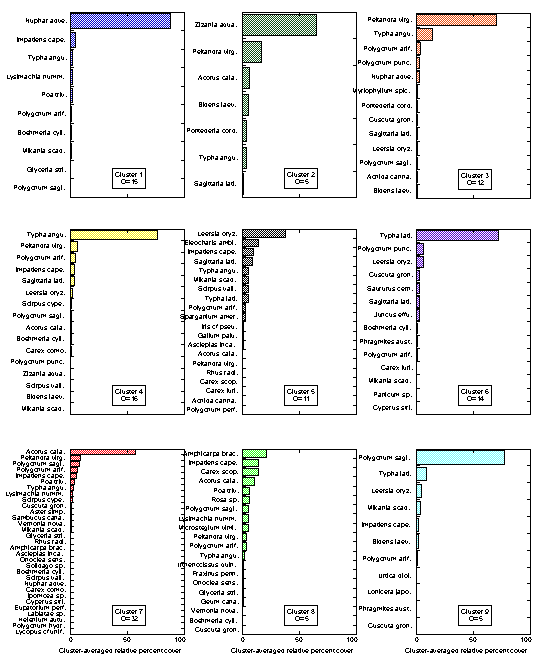
One of the major research tasks was to statistically analyze the large database of vegetation data to determine the extent to which the vegetation at Otter Point Creek is organized into distinguishable plant associations. Using a common multivariate statistical analysis approach, called cluster analysis, it was possible to determine that there are 9 major groupings of plant species at Otter Point Creek, as shown in figure 2 below. Seven of the plant associations have a single dominant species together with several low abundance taxa. For example, the first grouping has 88 % relative cover of Nuphar advena (aka spatterdock).
TFD Plant Association Gradient
The relative position of plant associations along the tidal freshwater marsh environmental gradient in OPC was assessed by comparing cluster analysis results to past research on tidal freshwater marshes. For example, it is widely recognized (and easy to see in the field) that the Nuphar advena association (cluster 1) is the most flood-tolerant. Consequently, it was put at the bottom of the gradient. The Zizania aquatica (cluster 2) and Peltandra virginica (cluster 3) associations are often characterized as ‘‘low marsh’’ indicators, so these were grouped together and placed at the next position. Similarly, the Typha angustifolia (cluster 4) and Leersia oryzoides—Eleocharis ambigens (cluster 5) associations were grouped and placed at the next higher position along the gradient. The Acorus calamus (cluster 7) association is less frequently flooded, so it was put at the second highest position. Finally, the remaining three associations were grouped at the highest position because cluster 8 represents levees, while clusters 6 and 9 were entirely composed of sites from the supratidal area at the upstream end of OPC (Figure 1 above).
Strong habitat type preferences exist for most species, such as those illustrated in Figure 3 below.

Habitat Index for Plant Gradient
Because a tidal freshwater marsh plant association is characterized by a set of species and their abundance, there is no direct means for quantitatively relating it to individual physical variables such as elevation and substrate. To overcome this problem, we hypothesized that the environmental gradient in tidal freshwater marsh plant associations could be numerically approximated using an ordination scheme. This approach is a type of direct gradient analysis (Whittaker 1978), and it has been used in the past to create indices that quantify wetland-upland transitions (Carter et al. 1988, Wentworth et al. 1988, Scott et al. 1989).
The best choice for a mathematical function to approximate an environmental gradient based on plant associations is a linear function. First, many mathematical functions are transformable into linear functions and vice versa, so using a linear function can capture the dynamics inherent in the widest array of non-linear processes. Second, deviations from linearity and their statistical significances are quantifiable. Third, the local slope of a line is independent of values on the line, so the definition of the scale of the function is irrelevant.
Starting with a linear function for the environmental gradient in a tidal freshwater marsh, plant associations must be positioned relative to one another along the gradient line. The relative positions of plant associations must be assumed initially, but the marsh ecology literature provides strong evidence for what those positions should be. For example, Odum et al. (1984) documented and illustrated the relative positions of individual plant species with respect to open water, low marsh, high marsh, and wooded swamp habitats. If the postulated relative positions are wrong, then geomorphic data such as elevation will not show quantitative trends with respect to the hypothesized plant gradient. Unlike relative positions, the actual position values are irrelevant, except that some agreed-upon scale must be chosen. Such ordinations are frequently adopted in science. The scale proposed here is to assign each plant association that exists at a different gradient position a number beginning with 1 5 open water, 2 5 pioneer mudflat, and ascending through 3, 4, 5, etc. as needed (e.g., Table 1). Note that two or more plant associations may occur at the same gradient position, which means that they conform to the same physical and chemical milieu but are different in terms of their plant species composition because of community dynamics such as competition, predation, and reproduction strategies.
Given a linear environmental gradient and the relative positions of plant associations, the position of individual plant species must be determined. A species occurring in only one association shows no distribution along the gradient, by definition, and thus takes on the position value assigned to its association. However, many species likely show a distribution among associations, as has been shown for other systems (Curtis 1959, Gemborys and Hodgkins 1971). For such a species, its distribution is obtained by dividing its cluster-average relative abundance in each association by the sum of cluster-average relative abundance for all associations:
DPDVia = (Ca/T)i
where DPDVia is the discrete probability density value for species i in plant association a, Ca is the percent cover of species i in plant association a, and T is the total percent cover for species i in all plant associations. Because the positions of plant associations along the environmental gradient have been numerically approximated, it is possible to quantitatively assess the distribution of DPDVih for each plant species. For example, is the distribution normal, uniform, exponential, etc.? Also, mean, standard deviation, or other relevant distribution parameters may be determined. This information provides insight into the ecology of individual species and marsh species overall. For example, uniformly distributed species have the widest tolerance to environmental conditions and are not useful for delineating marsh zones. Given the distribution of a plant species in the numerical terms of the above equation, the expected or preferred position of a species is given by the mean of its distribution:
PPi = SUM(a·DPDVia)
where PPi is the preferred position for species i, a is the gradient position value, and amax is the position value assigned to the plant association at the top of the environmental gradient. Once a database of expected gradient positions of all plant species is generated (e.g., see Pasternack (1998) for the database for OPC), it is possible to quantify the gradient position of any actual marsh site. To do this, the observed relative percent cover of each species in a quadrat is multiplied by the corresponding PPi, and then the values for all species are summed, yielding the ‘‘habitat index.’’ Rounding this to the nearest whole number gives the ‘‘designated habitat type,’’ which can be a useful simplification.
If the habitat index and the underlying hypothesized linear environmental gradient are indicative of real processes, then they should demonstrate strong relations with marsh structure and function. To test this, habitat indices were calculated for HBW sites and correlated with elevation. If a strong relation exists between the constructed variable (habitat index) and the independent variable (elevation), then the proposed environmental gradient theory is validated.
TFD Habitat Index Results
HBW Habitat Index Results
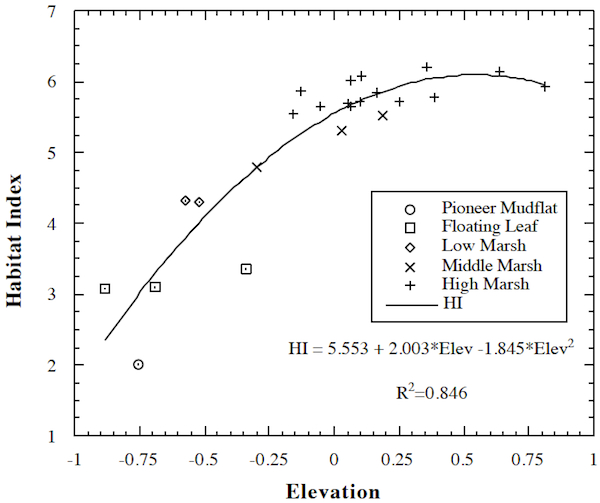 Out of the 23 locations surveyed in HBW, 13 were found to be high marsh, 4 were middle marsh, 2 were low marsh, 3 were floating leaf habitat, and 1 was a pioneer mudflat. The elevations at HBW averaged 22 cm and ranged from 227 to 25 cm. Remarkably, the 5 habitats spanned a mere 52 cm vertical range. A strong relationship between habitat index and elevation (r2 = 0.83) was found. Compared to their standard errors, the terms in the polynomial model are significant above the 99.8% confidence level. The strong correlation and high significances of model parameters validate the environmental gradient concept and algorithm.
OPC Habitat Index Results
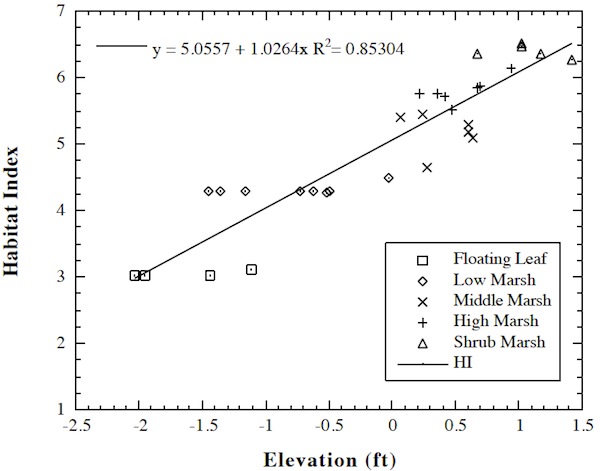 Out of 30 locations surveyed in OPC, 5 were found to be levee/shrub marsh, 7 were high marsh, 6 were middle marsh, 8 were low marsh, and 4 were floating leaf. The elevation of study sites at OPC averaged -1.39 cm (-0.046 ft.) and ranged from -61.81 cm (-2.03 ft.) to 43.40 cm (1.42 ft.). A strong linear relationship was found between habitat index and elevation. While some elevation overlap was present, each habitat had a small elevation range over which it was the only one present.
The habitat index was directly related to elevation and is less costly to obtain in the field than traditional topographic surveying. As a result, it could serve as a tool for preliminary wetland assessment.
Discussion
Tidal freshwater marsh plant associations at OPC show a distinct zonation. This zonation stems partly from the high abundance of rhizomatous plant species. Nuphar advena and Peltandra virginica are dominant perennials in lower elevation habitats, while Typha angustifolia, Typha latifolia, Acorus calamus, and Leersia oryzoides are dominant perennials at higher elevations. All of these species are known to occur widely in Atlantic coast tidal freshwater marshes (Simpson et al. 1983). Meanwhile, dominant annual species include Zizania aquatica, Eleocharis ambigens, and Polygonum sagittatum, with Impatiens capensis and Polygonum arifolium as important sub-dominants (Figure 2 above). Compared with salt marshes, the results from OPC confirm that the simple division into low and high marsh does not adequately characterize the structure of this ecosystem. Several more distinct zones occur, and each contains more species than reported for salt marsh zones.
Vegetation data from a series of Chesapeake Bay tidal freshwater marshes distributed along the axis of the estuary show a similar community structure as OPC. At Jug Bay Wetland in the Upper Patuxent River, Maryland, Nuphar advena, Peltandra virginica, Zizania aquatica, and Pontederia cordata dominate the lower elevation habitats, while Typha angustifolia and Typha latifolia dominate the high marsh (Khan and Brush 1994). At Sweet Hall Marsh in Pamunkey River, Virginia, Peltandra virginica and Leersia oryzoides have the highest biomass (Doumlele 1981).
In contrast to those of Chesapeake Bay, tidal freshwater marshes of the Delaware River have more annual species occurring in higher relative percentages that vary from year to year (Leck and Simpson 1987, Leck and Simpson 1994). Species such as Bidens laevis, Ambrosia trifida, and Zizania aquatica occur in significantly higher abundances along the Delaware River. However, the dominant perennials observed at Otter Point Creek are present and important vegetation components in the Delaware marshes.
Publications
- Pasternack, G. B. 1998. Physical dynamics of tidal freshwater delta evolution. Ph. D. Dissertation. The Johns Hopkins University, 227pp, 5 appendices.
- Pasternack, G. B., Hilgartner, W. B., and Brush, G.S. 2000. Biogeomorphology of an upper Chesapeake Bay river-mouth tidal freshwater marsh. Wetlands 20:3:520-537.
- Pasternack, G. B. and Brush, G. S. 2002. Biogeomorphic controls on sedimentation and substrate on a vegetated tidal freshwater delta in upper Chesapeake Bay. Geomorphology 43:293-311.
