Dr. Nikhil Kumar, Prof. Greg Pasternack, Prof. Yufang Jin
Project Organizations
University of California at Davis, San Jose State University, Contra Costa Resource Conservation District, Napa Resource Conservation District, North Santa Clara Resource Conservation District, SafeR3, University of California Agriculture and Natural Resources
Project Sponsors
This research was supported by funds from the Climate Action 2023 Seed Awards of the University of California, Grant Number R02CP6967. This project was also supported by the USDA National Institute of Food and Agriculture, Hatch project numbers CA-D-LAW-7034-H and CA-DLAW-2620-H.
Video Presentations
Methods and results from this research are presented in a series of videos at the links below:
Dr. Kumar's compound precipitation-wind extreme (CPWE) weather events video https://t.ly/5byAO
Dr. Kumar's webinar (9-Apr-2025), hosted by the School of Civil, Environmental, and Infrastructure Engineering at Southern Illinois University, Carbondale, titled: "Compound Precipitation-Wind Extremes and Socioeconomic Risks: Lessons from the San Francisco Bay Area" https://www.youtube.com/watch?v=am-Z1WcV3iY
Publications
Two journal articles are in various stages of production and scientific peer review. When published the links to them will be posted here.
Introduction
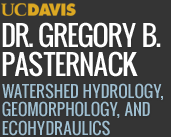
Global observational data document the evidence that our climate system is experiencing significant shifts, with substantial changes in weather patterns due to climate change. Future projections anticipate an increase in the frequency and intensity of extreme weather events (Field et al., 2012; Pörtner et al., 2022; WMO, 2022). Extreme events may occur as compound extremes, wherein the interaction of multiple hazards creates events that are more ecologically and socioeconomically destructive than single-hazard events (AghaKouchak et al., 2020; Masri et al., 2022; Zscheischler et al., 2020, 2018). Interestingly, the conditions of the single-hazard events that generate these compound extremes may not be always extreme on their own; it is their combined occurrence and interaction that amplify their overall impact. Considering such compound extremes, this study focused on precipitation and wind compound extreme events, termed CPWEs.
Increasing losses from natural hazards can be partly attributed to the hazards themselves, but are also a function of a population’s vulnerability and exposure (Adger, 2006; Calil et al., 2017; IPCC, 2014a). Factors such as population growth, poor or limited land-use planning, law/regulation enforcement, poverty, environmental degradation, demographic shifts, inadequate housing, and the intensifying effects of climate change all play a significant role (Aroca-Jiménez et al., 2018; Li et al., 2013; Yin et al., 2015). A population's sensitivity to hazards, combined with its ability to respond and recover, defines its social vulnerability (Cutter, 1996; Cutter et al., 2012). Social vulnerability arises when social, political, and economic factors combine to increase certain populations' susceptibility to hazards (Cutter et al., 2012; Emrich and Cutter, 2011).
Study Purpose
The overal purpose of this study was to assess compound precipitation-wind extremes (CPWEs) in a relatively small, densely populated and vulnerable region with complex climatic, physiographic, and socio-economic gradients – the nine-county San Francisco Bay Area (SFBA). Research was conducted independent for three periods- contemporary (1982-2022), near future (2034-2066), and far future (2067-2099).
Contemporary CPWEs
This part of the study addressed contemporary CPWEs and their socio-economic risks. It answered three questions. This integrated approach can facilitate policy changes that promote social equity and effective mitigation in the face of CPWE-related hazards and contribute to the development of more resilient urban communities.
First, what is the spatial distribution and temporal trend of CPWEs in a tectonically active area, characterized by strong physiographic and land-use gradients?
Second, how do CPWEs vary across counties, and how do these variations relate to local differences in social vulnerability?
Third, does a complex region like the SFBA face a relatively uniform risk from CPWEs or are there distinct hotspots of CPWEs and social vulnerability?
Near & Far Future CPWEs
This part of the study addressed future trends in the frequency and intensity of CPWEs in the SFBA under two emission scenarios: a medium-emission scenario (SSP2-4.5) and a high-emission scenario (SSP5-8.5), using a relatively fine-scale (~4 km) climate datasets. To achieve this goal, the study answered one key scientific question:
How will the frequency and intensity of extreme precipitation events (EPEs), extreme wind speed events (EWSEs), and their combined occurrence as CPWEs change in the future across different timescales (1-day, 3-day and 5-day) in the region?
Study Area
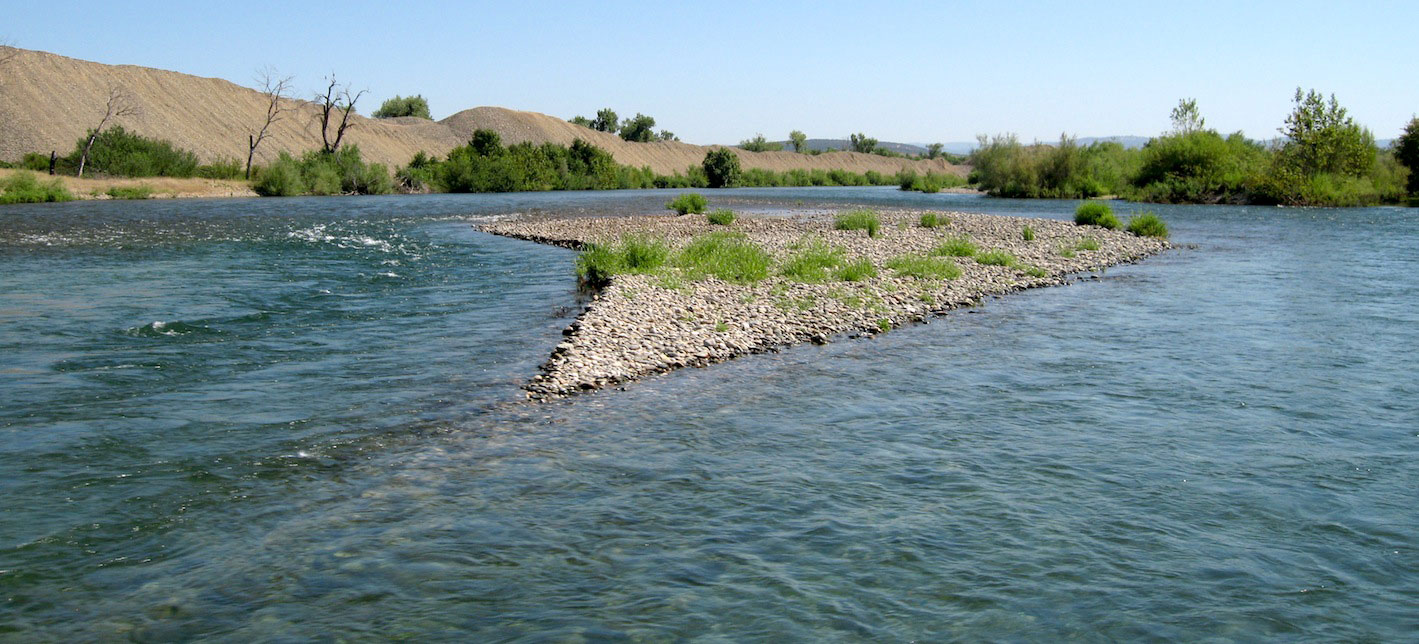
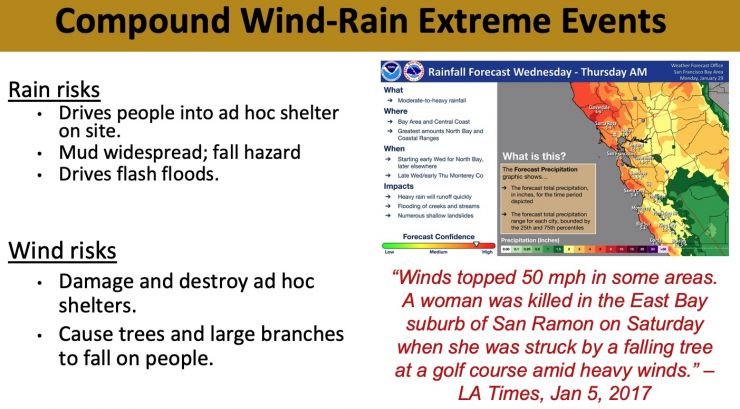
The San Francisco Bay Area (SFBA) encompasses nine counties with a diverse geography of coastal areas, valleys, and hills, resulting in significant microclimatic variation across the region (Ackerly et al 2018). The region experiences a Mediterranean climate, characterized by cool, wet winters and warm, dry summers.
This region also has an extreme range of socio-ecnomic wellbeing, going from people with nothing to billionaires. It is home to stream-side encampments of unsheltered people and the headquarters of high tech corporations.
Methods
Data Sources
For contemporary analysis, this study used the gridMET dataset, which offers daily meteorological information at a 4-km resolution for the contiguous United States, covering the period from 1979 to the present (Abatzoglou, 2013).
For future projections, we use the CMIP6-Based Multi-Model Hydroclimate Projection for the Conterminous U.S. Version 1.1 (MHP-CUS-V1.1) dataset, developed by Oak Ridge National Laboratory (Kao et al 2022). To evaluate CMIP6 projections, we use the gridMET dataset, which provides daily precipitation and wind speed at a ~4 km spatial resolution for the contiguous United States, spanning 1979 to the present (Abatzoglou 2013). For our analysis, we incorporate all seven CMIP6 GCMs from the MHP-CUS-V1.1 dataset under SSP2-4.5 and SSP5-8.5 scenarios. The historical period (1982–2014) is used for evaluation, while projections focus on the near-future (2034–2066) and far-future (2067–2099) periods.
This study used 2018-2022 socio-economic data from the ACS 5-year estimates (2018-2022) at the census tract level. Conducted by the U.S. Census Bureau, the ACS provides continuous, detailed insights into the social, economic, housing, and demographic characteristics of communities across the United States (Census, 2024). To assess socio-economic vulnerability in the SFBA, we employed the Social Vulnerability Index (SVI) created by the Centers for Disease Control and Prevention (CDC) and the Agency for Toxic Substances and Disease Registry (ATSDR) (Flanagan et al., 2011). The SVI ranks tracts according to 16 social factors grouped into four key themes: Socioeconomic Status, Household Characteristics, Racial and Ethnic Minority Status, and Housing Type and Transportation.
Statistical Methods
Extreme precipitaiton events (EPEs) and Extreme wind speed events (EWSEs) are defined as days when daily precipitation and wind speed exceed the 98th percentile threshold, respectively. The 98th percentile was chosen as it identifies statistically rare but sufficiently frequent events, providing a balance between statistical robustness and impact relevance (Zhang et al 2011). Events exceeding this threshold are associated with significant environmental and societal impacts, including flooding, landslides, wind-related destruction, and surface runoff (Froidevaux et al 2015, Klawa and Ulbrich 2003, Guzzetti et al 2008).
The return period (RP) represents the average time between occurrences of extreme events.
After identifying CPWEs, we calculated the decadal frequency of this compound weather extreme using a 10-year moving window starting from 1982. We used the non-parametric Mann-Kendall test (Mann, 1945) and Sen’s Slope estimator (Sen, 1968) to detect time-series trends with a 95% confidence level and determine trend magnitude, respectively.
To explore the spatial relationship between CPWEs and social vulnerability across the SFBA, we employed Bivariate Local Indicators of Spatial Association (LISA) statistics. Bivariate LISA maps illustrate the spatial pattern of how values of one variable, in this case CPWEs, are spatially correlated with values of a second variable, the SVI (Anselin, 1995). Positive spatial autocorrelation occurs when high values of CPWEs are surrounded by high SVI values (High-High clusters), or low CPWE values are surrounded by low SVI values (Low–Low). Negative spatial autocorrelation is observed when high CPWE values are surrounded by low SVI values (High-Low clusters), or vice versa (Low-High clusters).
To compute local and global spatial autocorrelation and map the resulting clusters with their statistical significance, we utilized GeoDa spatial data analysis software (version 1.14) (Anselin et al., 2022).
The performance of the MHP-CUS-V1.1 CMIP6 dataset was evaluated by comparing key attributes of CPWEs against the gridMET dataset during the historical period 1982–2014, focusing on both frequency and intensity. Model skill was assessed using spatial correlation (R > 0.80 indicating strong pattern agreement) and relative bias (within ± 15 % indicating strong agreement in magnitude).
Results
For the period 1982-2022, we found that the return period for CPWEs in the SFBA ranges from 0.5 to 2 years, suggesting nearly annual occurrences. Over recent decades, these events have become more frequent (an increase of 2 events per decade) and more intense, particularly in terms of daily precipitation trends (an increase of 0-5 mm/decade), across the SFBA. Key urban centers, such as San José and Oakland, emerged as hotspots where high CPWE frequency coincides with high levels of social vulnerability due to economic constraints, inadequate housing, and limited transportation access.
Results of analysis of future scenarios indicate a substantial future increase in both the frequency and intensity of extreme precipitation events (EPEs), with longer-duration EPEs becoming more frequent than shorter-duration events. In contrast, extreme wind speed events (EWSEs) show little to no change in intensity but a decline in frequency across all timescales. Given these contrasting trends, CPWE frequency varies across timescales. At shorter durations (1-day), fewer EWSEs limit the co-occurrence of extremes, leading to fewer CPWEs. However, at longer durations (3-day and 5-day), more frequent and prolonged EPEs drive an increase in CPWE frequency for both scenarios, despite weakening wind speeds. CPWEs are also intensifying across all timescales, primarily due to stronger precipitation, while wind speeds remain largely unchanged. As a result, longer-duration CPWEs will not only occur more frequently but will bring heavier precipitation, increasing their severity and amplifying flood risks.